

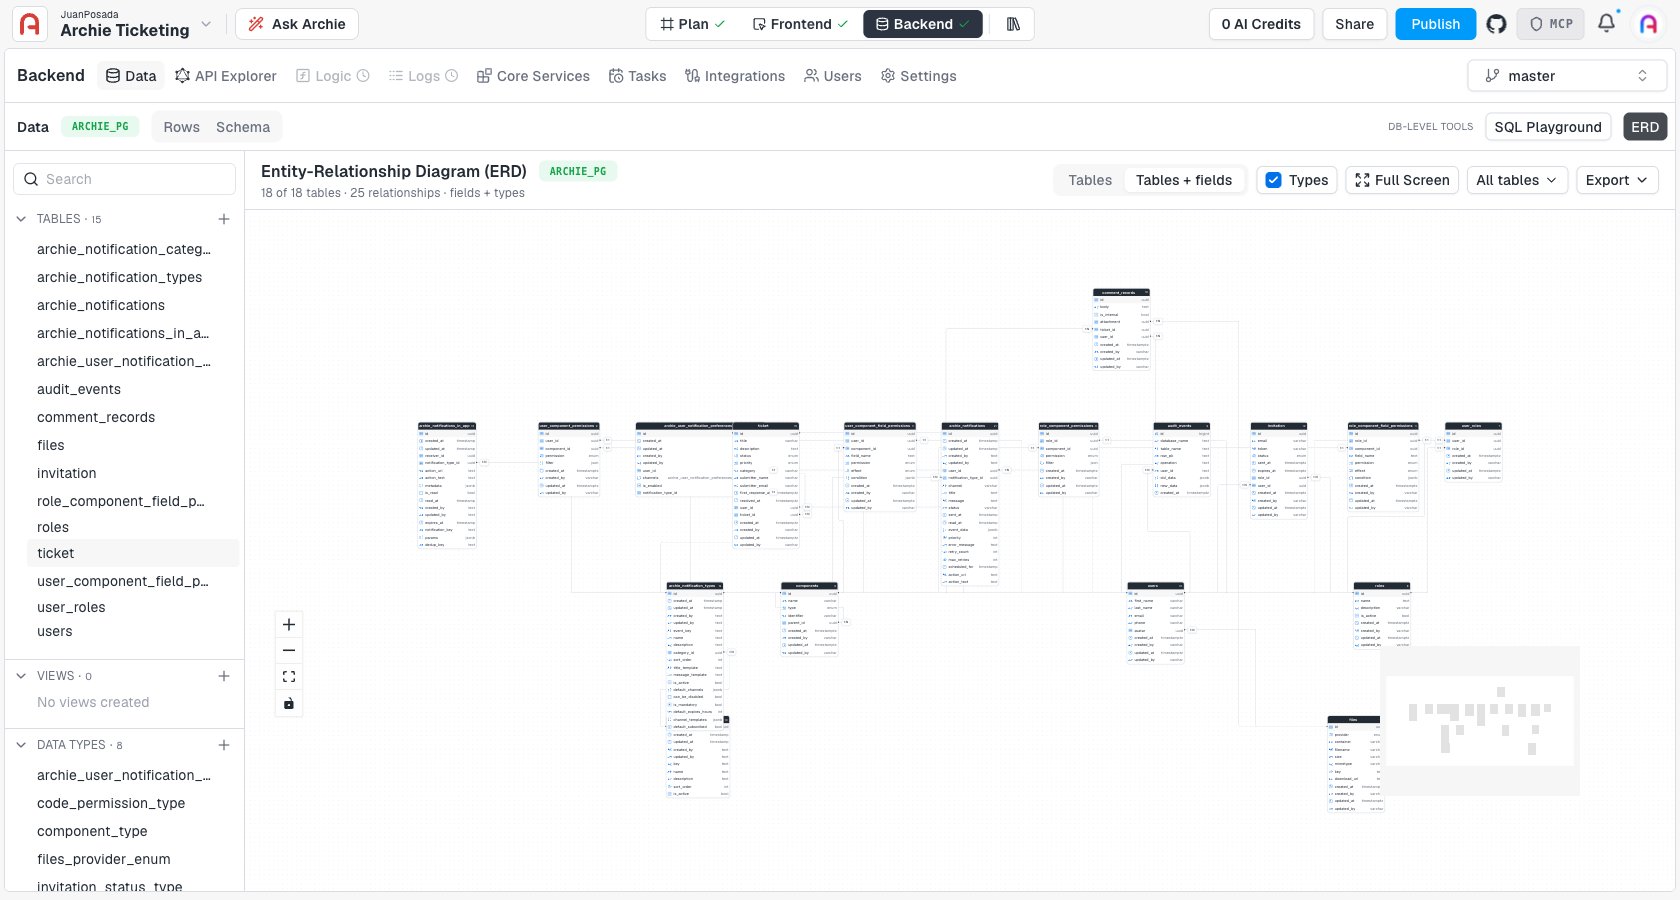
What you’re looking at
Each box is a table, with its column names and data types. Lines connect related tables, and a small badge on each line — 1:1, 1:N — shows the cardinality of that relationship. The header bar reports the diagram’s scope at a glance, for example “18 of 18 tables · 25 relationships · fields + types.” Zoom into a table and each field shows a type icon: a key icon foruuid identifiers, A-Z for text fields, a checklist icon for enum, and a clock icon for date/time fields.
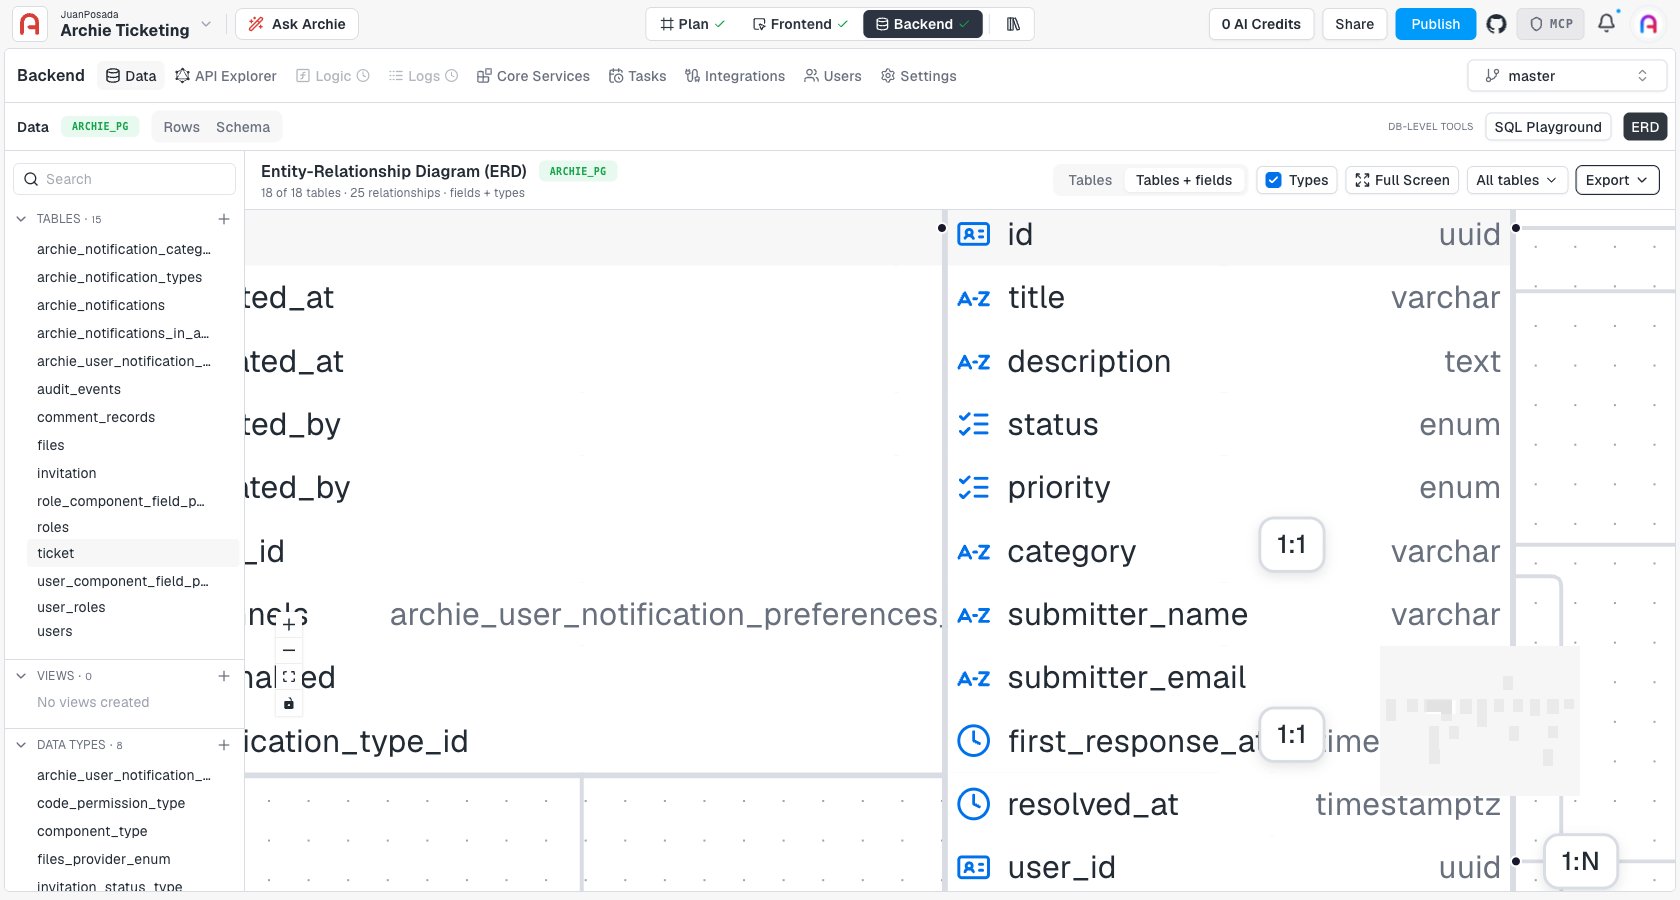
Detail level
Two toggles in the toolbar control how much the diagram shows:- Tables / Tables + fields — collapse boxes to just their table name, or expand them to list every column.
- Types — show or hide the data type next to each field.
Navigating a large schema
For projects with many tables, the diagram gives you a few ways to manage the view:- Zoom and pan — scroll to zoom, drag to pan. The + / − controls and a fit-to-screen button sit in the bottom-left corner, along with a minimap for jumping around a large diagram.
- Full Screen — expand the diagram to the whole browser window.
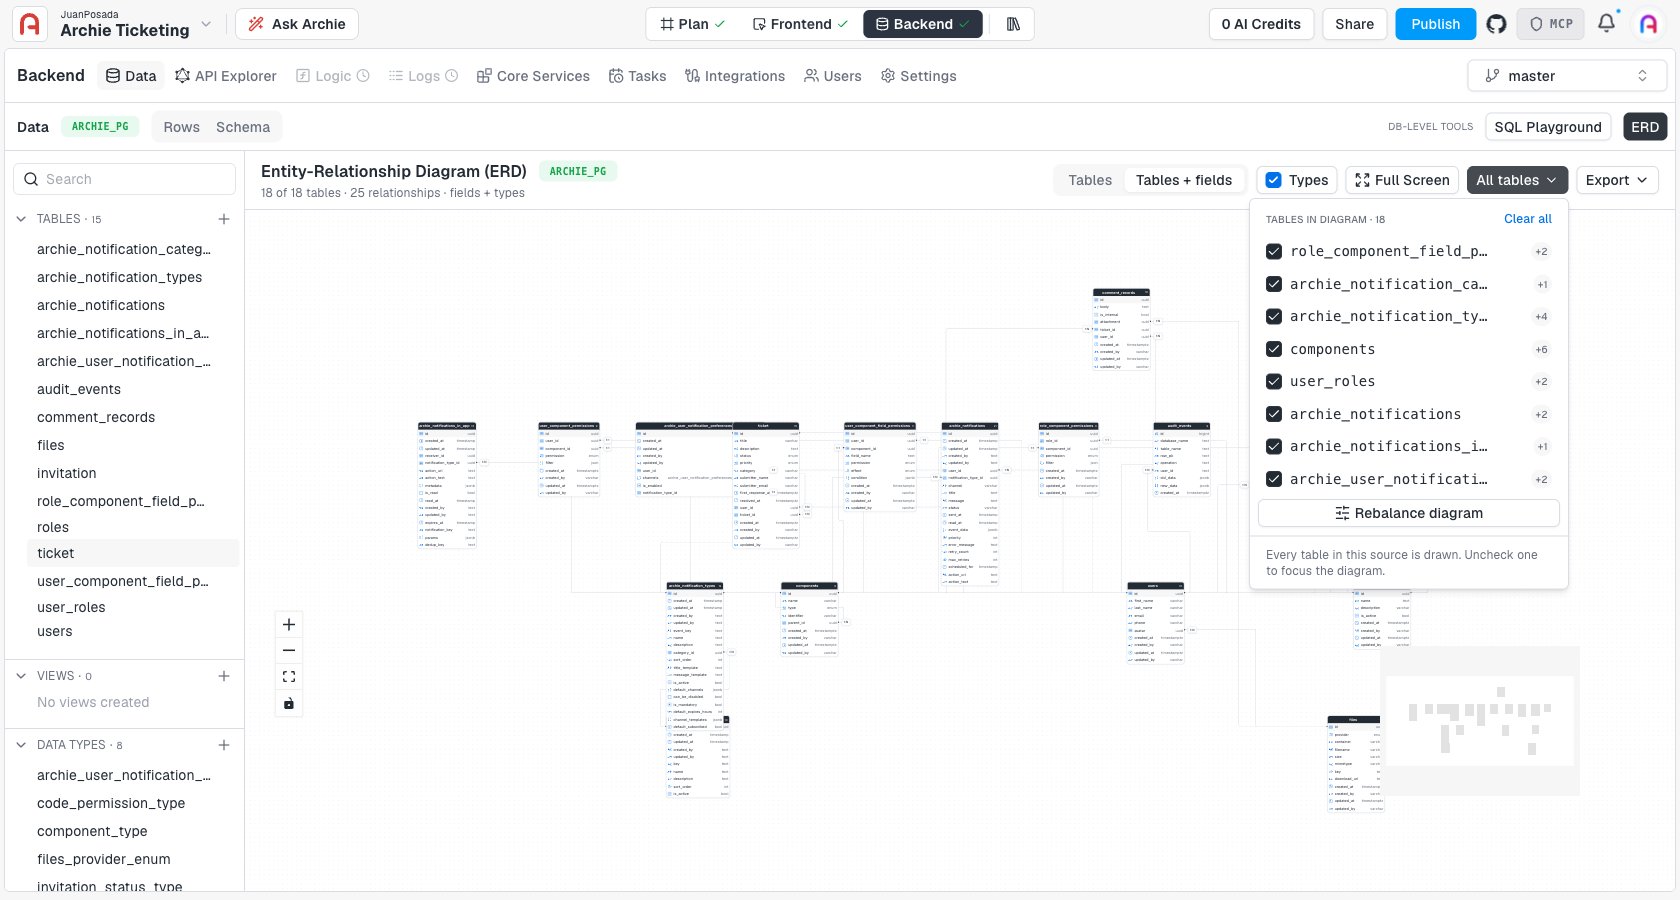
- All tables filter — a dropdown listing every table in the diagram with a checkbox next to each. Uncheck a table to drop it from the view and focus on a subset of your schema; a Rebalance diagram button re-lays-out the remaining tables, and Clear all hides everything so you can build the view up table by table.
Exporting
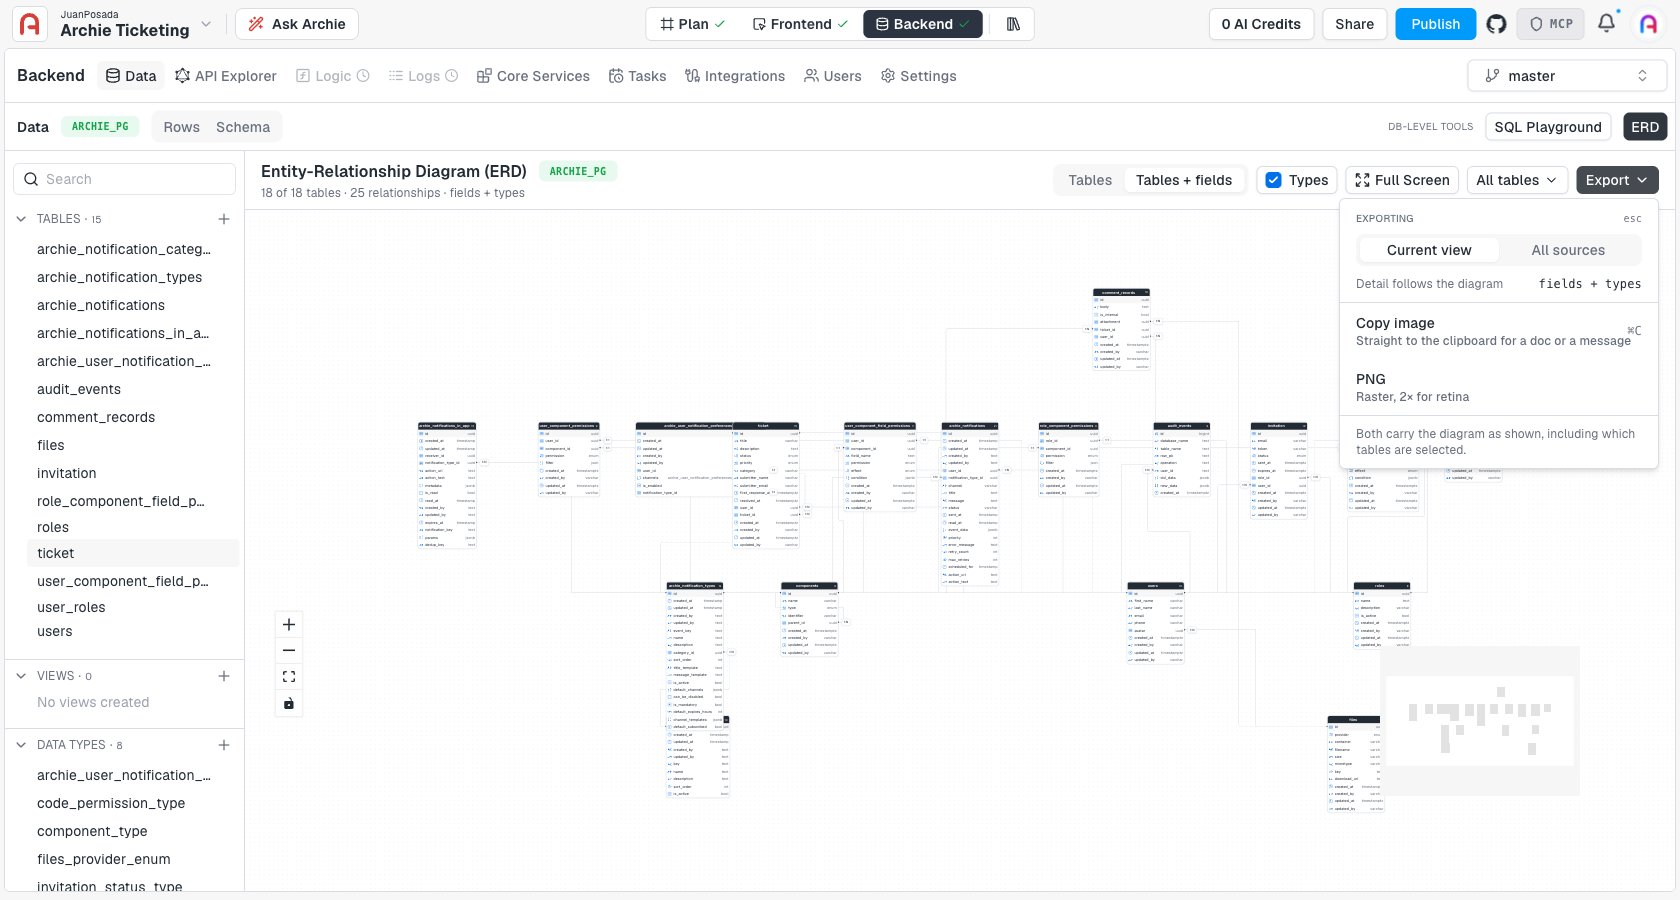
The Export dropdown turns the diagram into something you can paste into a doc or share with your team:- Current view / All sources — export just what’s on screen, or every table regardless of the current filter.
- Copy image (
⌘C/Ctrl+C) — copies the diagram straight to your clipboard. - PNG — downloads a 2x, retina-resolution raster image.
Per-environment
The ERD reflects the schema of whichever environment is currently selected. Switch environments to compare a branch’s schema changes againstmaster before merging.
FAQ
Can I edit the schema from the ERD?
Can I edit the schema from the ERD?
No. The ERD is read-only — it’s a visualization of the schema, not an editor. Make schema changes on the Data page’s Schema tab.
Does the ERD update automatically when I change a table?
Does the ERD update automatically when I change a table?
Yes. It’s generated live from the current schema, so adding a table or field, or changing a relationship, is reflected the next time you open or refresh the ERD.
What do the 1:1 and 1:N badges mean?
What do the 1:1 and 1:N badges mean?
They show the cardinality of the relationship between the two connected tables — one-to-one or one-to-many — based on how the relationship field is configured.
Can I export just part of my schema?
Can I export just part of my schema?
Yes. Use the All tables filter to uncheck the tables you don’t want, then export with the scope set to Current view — only the tables still checked are included.